Showing posts with label Charts. Show all posts

Tuesday, September 7, 2010

Smoothie Charts


Smoothie Charts is a really small charting library designed for live streaming data. I built it to reduce the headaches I was getting from watching charts jerkily updating every second. What you're looking up now is pretty much all it does. If you like that, then read on.
It currently only works in Chrome and Safari 5.
 http://joewalnes.com/2010/08/10/introducing-smoothie-charts/

Sunday, January 3, 2010

JavaScript Charts Roundup

Flot

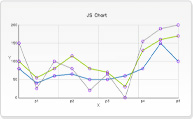
Flot is a jQuery-based JavaScript plotting library, which focuses on simple usage. The results are fairly attractive, and has some interactive features, such as zooming. It works with all modern browsers (including IE6+, where Google’s ExCanvas is used). If you’re into Prototype, check out Flotr, a Prototype port.

jqPlot

This is another jQuery plugin, and produces results not dissimilar to Flot. It provides quite a wide range of graphing options.

dojo Charts

Dojo Charting, part of the Dojo Toolkit, provides many common chart types including line, bar, area and pie charts.

Bluff

Bluff is a James Coglan’s JavaScript port of Ruby’s Gruff graphing library. It depends on James’ JS.Class (and ExCanvas to support IE).

PlotKit

PlotKit is based on MochiKit, but unfortunately only supports IE6+ via Adobe’s discontinued SVG viewer.

Protochart

Inspired by Flot and PlotKit, Protochart build upon Prototype and ExCanvas, providing a good range of charting options.

Google Visualisations

Google Visualizations provide a variety of ways to represent your data, including charts from the Google Chart API as well as pure client-side visualizations (some of which require Flash).

Yahoo UI Charts

YUI charts let you visualize tabular data on a web page in a variety of different ways, but unfortunately the chart control depends on Flash 9.

Processing

This is not just restricted to charts, and it doesn’t support IE (yet), but I wanted it to include it anyway as, like Raphaël, Processing is such a powerful tool.

http://dailyjs.com/2009/12/15/javascript-charts-roundup/

Sunday, June 14, 2009

JavaScript InfoVis Toolkit

The JavaScript InfoVis Toolkit provides tools for creating Interactive Data Visualizations for the Web.

Features
  • Multiple Data Representations
    Treemaps, Radial Layouts, HyperTrees/Graphs, SpaceTree-like Layouts, and more...
  • Major Browsers Support
    IE6+, Firefox2+, Safari3+, Opera9.5+
  • Open Source
    Licensed under the BSD License
  • Library Agnostic
    You may use the JIT with your favorite DOM manipulation framework
  • Extensible
    All visualization classes are mutable, so you can easily add/override any method you want.
  • Composable
    Visualizations can be combined in order to create new visualization methods.
http://thejit.org

Sunday, May 24, 2009

Axiis

Axiis has been designed to be a concise, expressive, and modular framework that let developers and designers create compelling data visualization solutions by assembling easy to understand building blocks into simple or complex visual representations of data.

Axiis takes a very visual approach to development in both the markup language itself as well as the concepts used to create data visualizations.

The two primary concepts to understand in Axiis are Geometry and Layout.

Geometry: All data visualizations are ultimately represented as one or more sets of simple or complex geometries that plot specific data points relative to visual coordinates. To that end, Axiis leverages the Degrafa framework to describe its geometries.

Layout: The Axiis layout classes are the heart of the framework, as they allow the developer to describe in simple terms how they want to translate sets of data into geometric representations. The layout classes allow developers to use and combine pre-built layout schemes as well as build their own to create anything from standard cartesian charts to wild yet-to-be imagined data visualizations.

http://code.google.com/p/axiis
http://www.axiis.org

Thursday, March 26, 2009

Protovis. A graphical toolkit for visualization

Protovis is a visualization toolkit for JavaScript using the canvas element. It takes a graphical approach to data visualization, composing custom views of data with simple graphical primitives like bars and dots. These primitives are called marks, and each mark encodes data visually through dynamic properties such as color and position. For example, this simple bar chart visually encodes an array of numbers with height:
new pv.Panel().width(150).height(150)
.add(pv.Bar)
.data([1, 1.2, 1.7, 1.5, .7, .3])
.bottom(0)
.width(20)
.height(function(d) d * 80)
.left(function() this.index * 25)
.root.render();

Although marks are simple by themselves, you can combine them in interesting ways to make rich, interactive visualizations. To facilitate this, Protovis supports panels and inheritance. A panel is a container for marks; the contained marks are replicated for each data point on the panel. You can vary the panel position to create small multiple displays, or you can overlay panels, such as in this stacked area chart of sine waves:

new pv.Panel().width(150).height(150)
.add(pv.Panel)
.data([[Math.sin(x / y)
for (x in pv.range(50))]
for (y in pv.range(3, 9))])
.add(pv.Area)
.data(function(d) d)
.fillStyle(pv.Colors.category19.unique)
.bottom(function() let (c = this.cousin())
c ? (c.bottom + c.height) : 0)
.height(function(d) (d + 1) * 13)
.left(function() this.index * 3)
.root.render();

Inheritance lets you derive new marks from existing ones, while sharing some or all of the same properties. This is the same principle as cascading in CSS, or prototypal inheritance in JavaScript. For example, here we derive labels for a rule and a bar:

new pv.Panel().width(150).height(150)
.bottom(9.5).left(20)
.add(pv.Rule)
.data(function() pv.range(0, 2, .5))
.bottom(function(d) d * 70)
.anchor("left").add(pv.Label)
.root.add(pv.Bar)
.data([1, 1.2, 1.7, 1.5, .7])
.height(function(d) d * 70).width(20)
.bottom(0).left(function() this.index * 25 + 4)
.anchor("bottom").add(pv.Label)
.root.render();
http://vis.stanford.edu/protovis/

Monday, February 9, 2009

JS Charts

JS Charts is a free JavaScript based chart generator that requires little or no coding. With JS Charts drawing charts is a simple and easy task, since you only have to use client-side scripting (i.e. performed by your web browser). No additional plugins or server modules are required. Just include our scripts, prepare your chart data in XML or JavaScript Array and your chart is ready!

JS Charts lets you create charts in different templates like bar charts, pie charts or simple line graphs.


http://www.jscharts.com/

Sunday, January 18, 2009

Raphaël

Raphaël is a small JavaScript library that should simplify your work with vector graphics on the web. If you want to create your own specific chart or image crop and rotate widget, for example, you can achieve it simply and easily with this library.

Raphaël uses the SVG W3C Recommendation and VML (mostly equivalent Internet Explorer implementation) as a base for creatinggraphics. This means every graphical object you create is also a DOM object, so you can attach JavaScript event handlers or modify them later. Raphaël’s goal is to provide an adapter that will make drawing vectorart (similar to Flash) compatible cross-browser and easy.

Raphaël currently supports Firefox 3.0+, Safari 3.0+, Opera 9.5+ and Internet Explorer 6.0+.
http://raphaeljs.com/

Tuesday, January 13, 2009

Timeplot

Timeplot is a DHTML-based AJAXy widget for plotting time series and overlay time-based events over them (with the same data formats that Timeline supports).
Just like Timeline or Google Maps, Timeplot can be used with zero software installation, server-side or client-side. You can populate Timeplot with data by pointing it to an space or comma separated file (here is one of the data file for the timeplot above). Timeplot also supports Timeline's XML format, meaning that you can reuse the same data file of your Timeline and overlay them over a time series plot (here is the event file for the timeplot above).


http://simile.mit.edu/timeplot/
http://simile.mit.edu/wiki/Timeplot
http://code.google.com/p/simile-widgets/

Flotr Javascript plotting library

Flotr is a javascript plotting library based on the Prototype Javascript Framework (version 1.6.0.2 at the moment) and inspired by Flot (written by Ole Laursen).
Flotr enables you to draw appealing graphs in most modern browsers with an
easy to learn syntax. It comes with great features like legend support, negative
value support, mouse tracking, selection support, zoom support, event hooks, CSS
styling support and much more.

http://solutoire.com/flotr/

pChart - a PHP class to build charts

pChart is a PHP class oriented framework designed to create aliased charts. Most of todays chart libraries have a cost, our project is intended to be free. Data can be retrieved from SQL queries, CSV files, or manually provided. This project is still under development and new features or fix are made every week.

Focus has been put on rendering quality introducing an aliasing algorithm to draw eye candy graphics. Rendering speed has been dramatically enhanced since the first version, we'll still continue optimising the code!


http://pchart.sourceforge.net/